 Commandix
Commandix guide
Dashboard
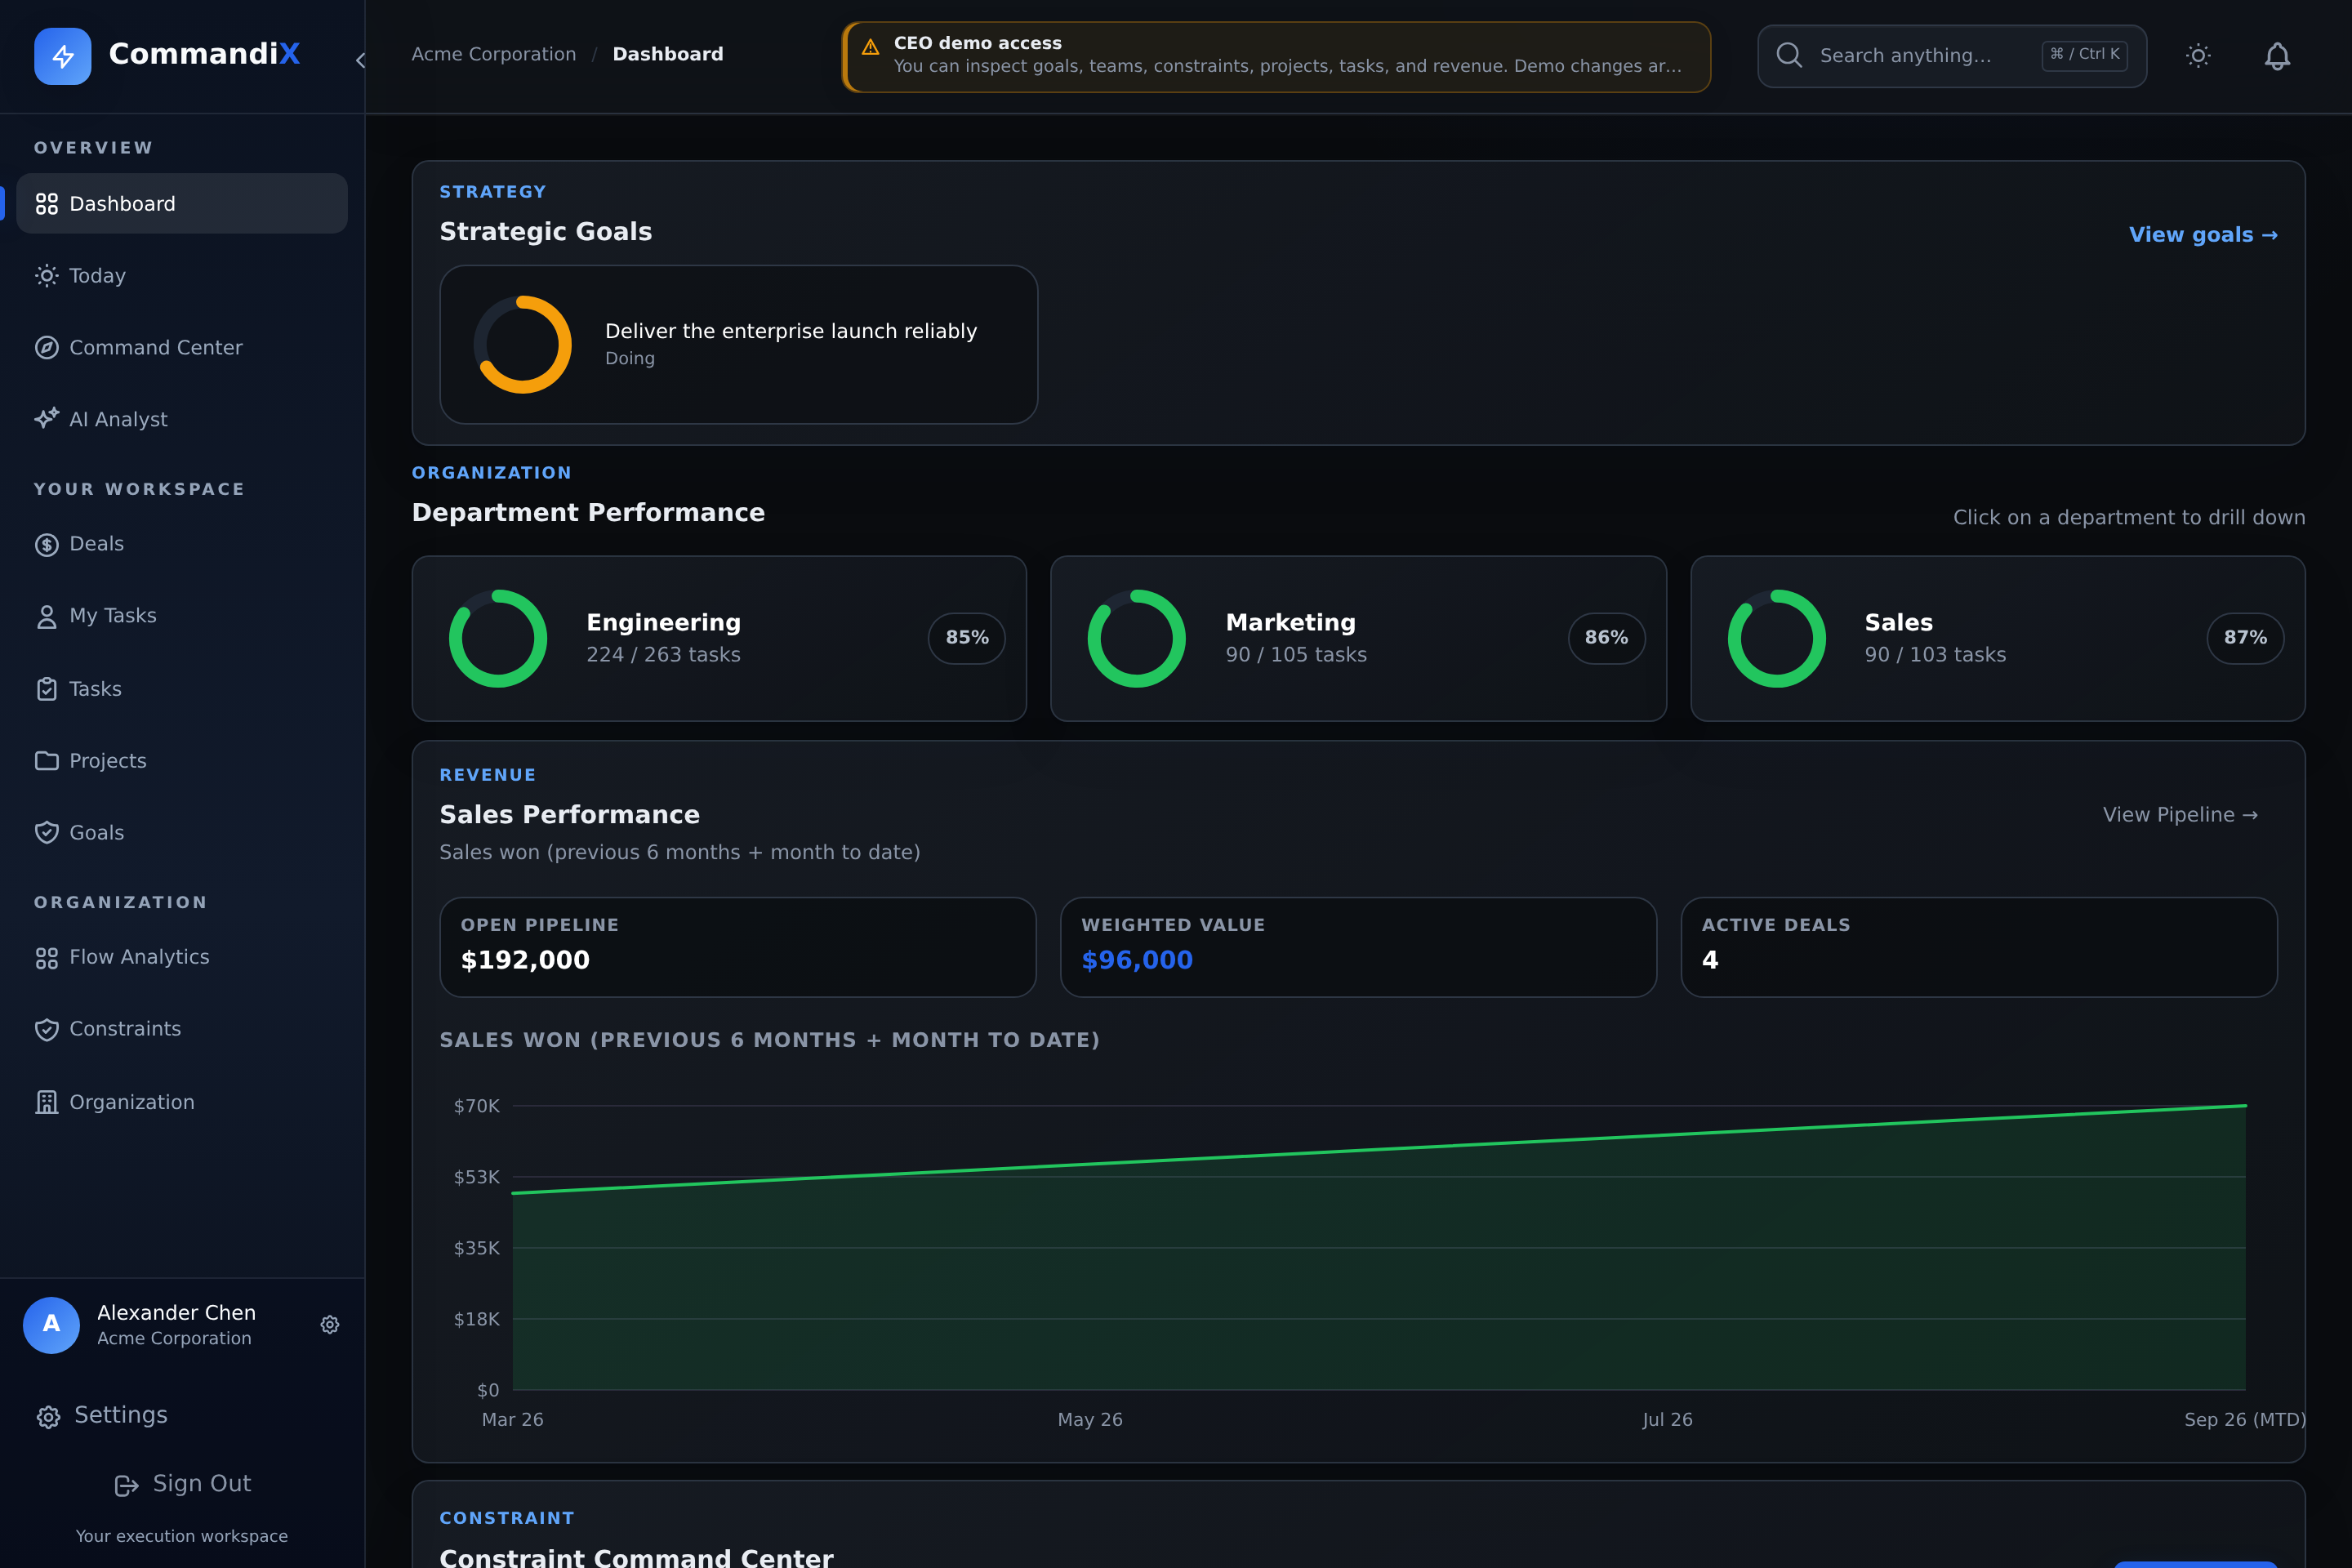
Use Dashboard for a role-based overview of goals, departments, sales, and work in progress. Select a signal to open the underlying work.
Last reviewed September 19, 2026
View this screen in Commandix
 Enlarge
Dashboard and Command Center are separate sidebar destinations. Command Center is the leadership brief for reviewing the current constraint, its owner, a next action, and the result to check.
What the dashboard shows
Strategic goals strip
Managers and executives see active company goals with progress gauges and status. Selecting a goal opens the goal detail page.
Department overview
Department heads see total, completed, active, blocked, overdue, unassigned, and completion metrics for their managed unit.
Personal work
Members see assigned work, due work, active tasks, blocked work, and completion trends.
Sales trends
Users with sales access see pipeline and won-value trend data pulled from the Sales module.
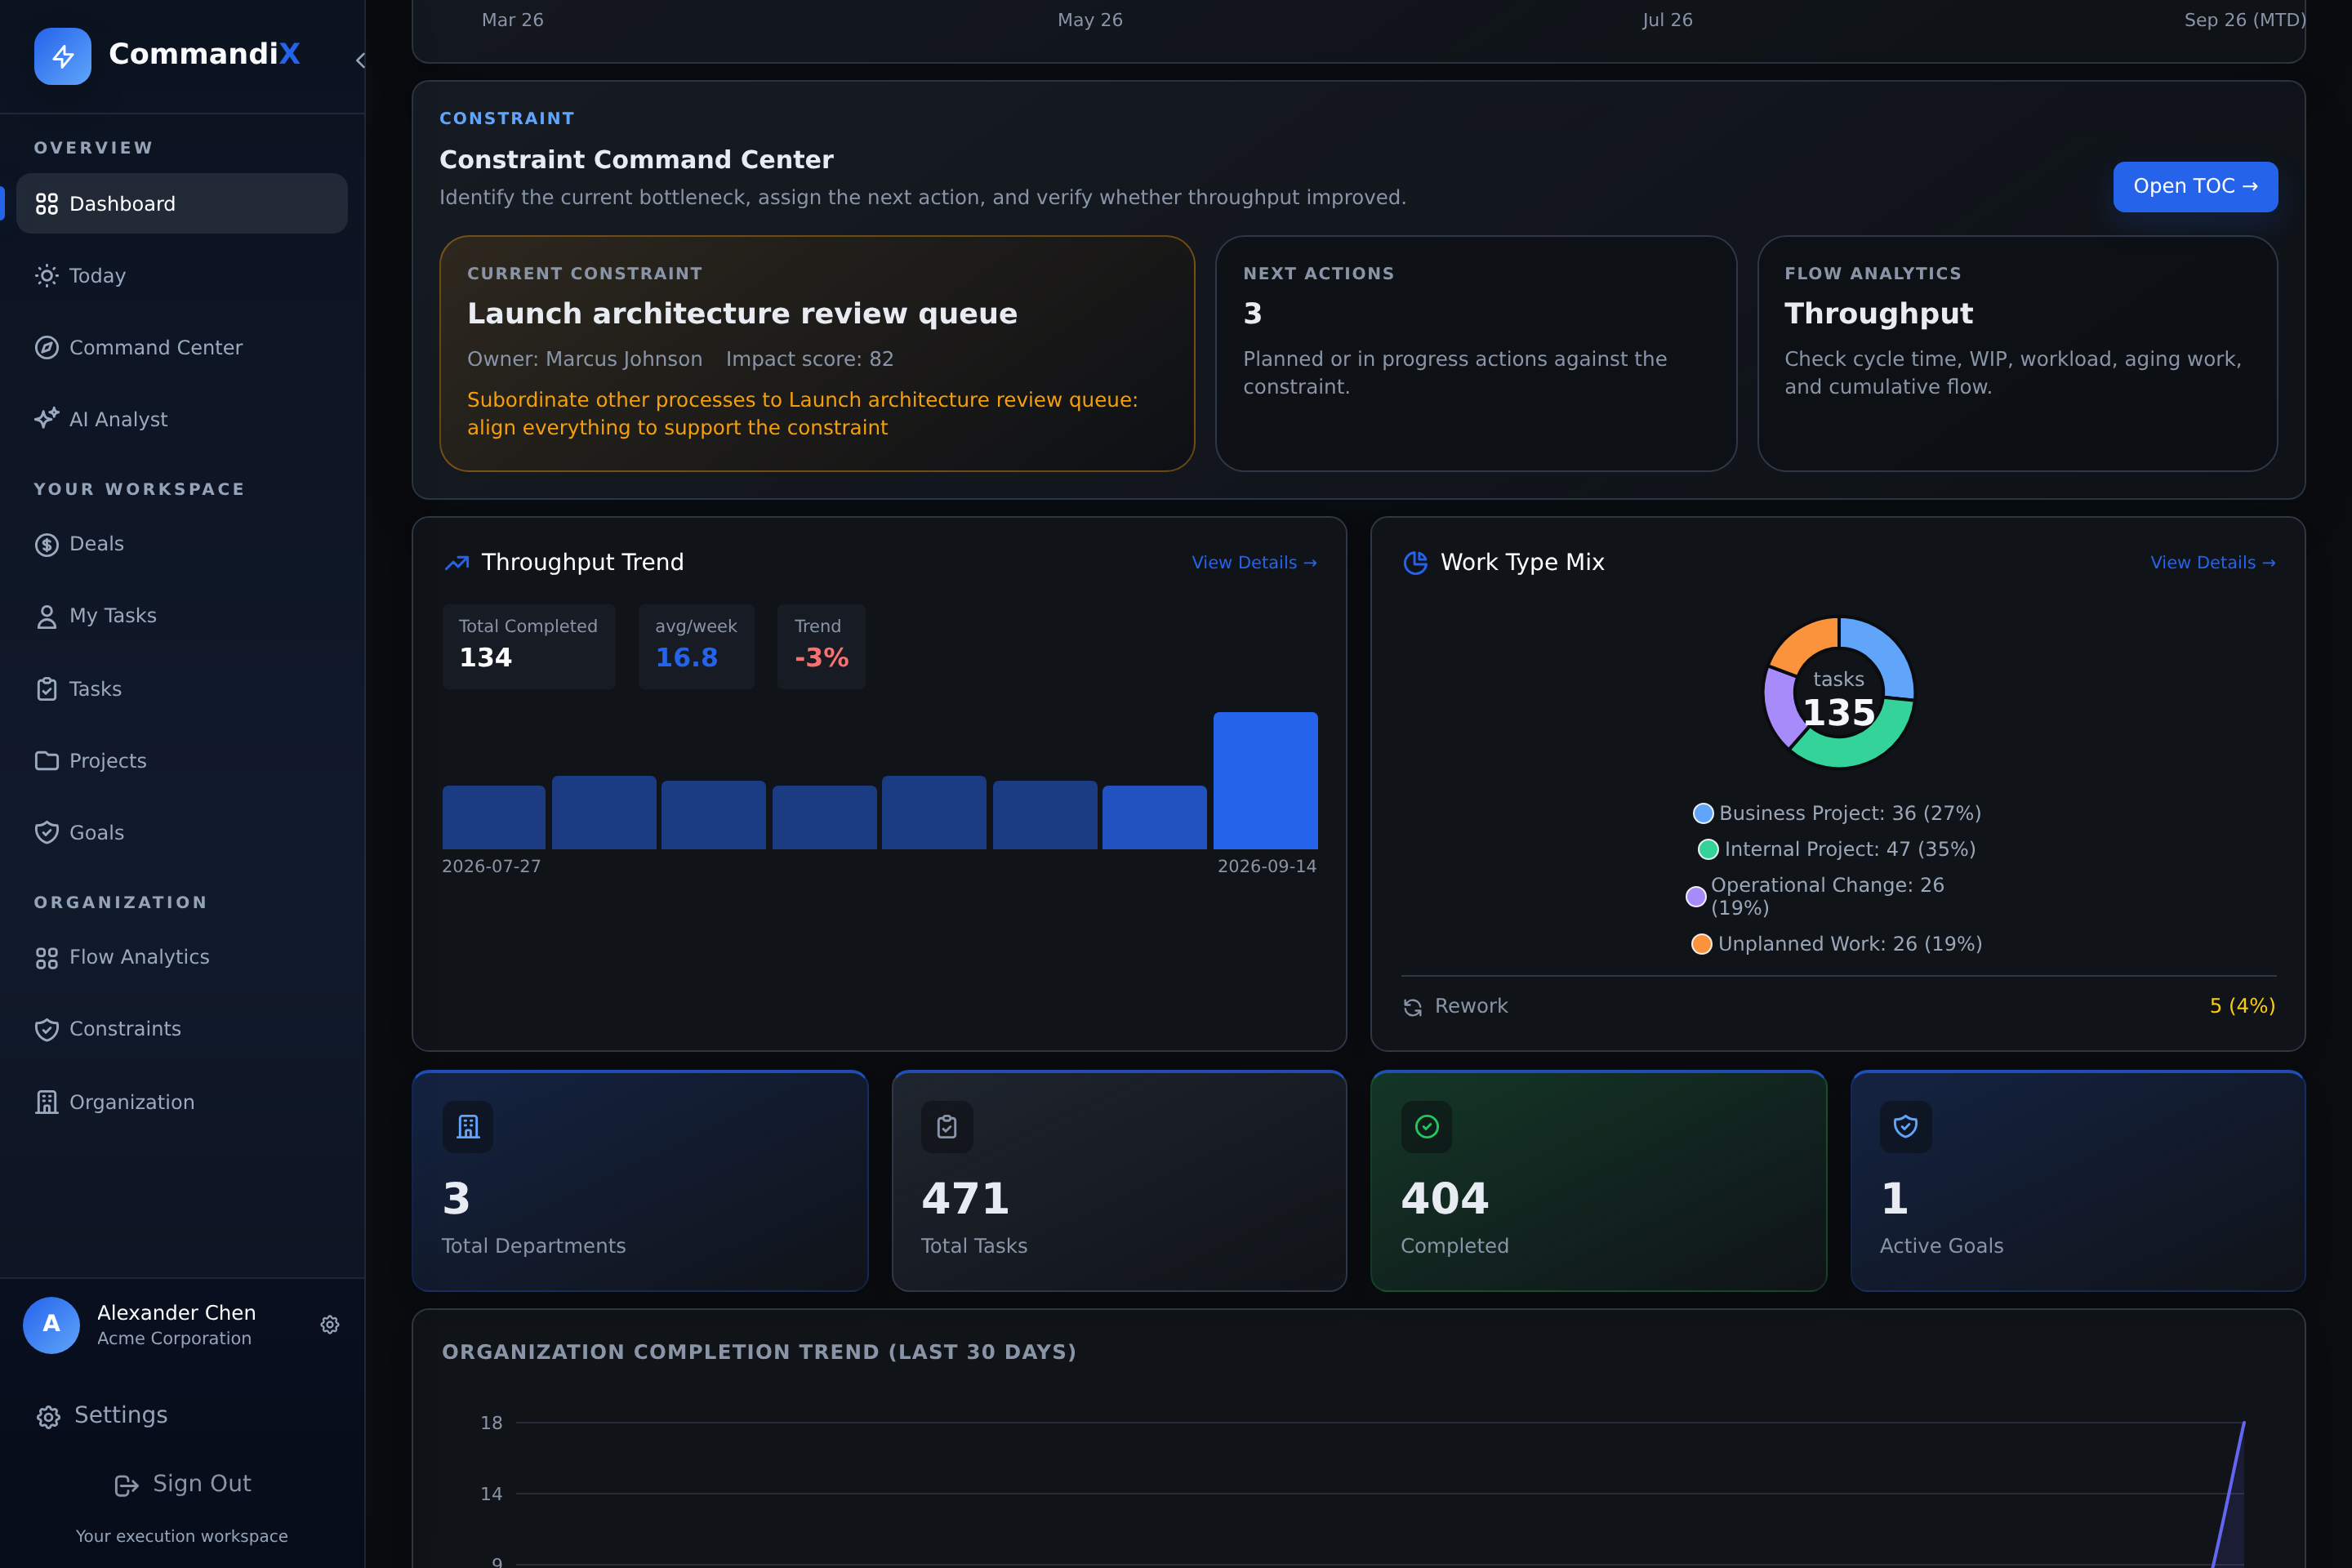
TOC widgets
Throughput and work-type widgets help reveal whether work is flowing or being consumed by unplanned/rework.
Read chart periods before comparing totals
- Throughput Trend shows eight weekly buckets. The current week can be incomplete; the trend comparison excludes that partial week.
- Work Type Mix counts tasks created in the last 30 days, grouped into Business Project, Internal Project, Operational Change, and Unplanned Work. Rework is a separate flag, so it can overlap any work type.
- Organization completion trend shows currently Done tasks by their last-updated date in the last 30 days. Editing a Done task can move its date in this chart. It is not an immutable completion-event ledger.
- Sales won shows the previous six calendar months plus the current month to date. Do not compare a partial month with a full month as though both periods were complete.
- Next actions counts planned and in-progress constraint actions. Completed actions remain on the Actions page but are not counted as next actions.
 Enlarge
How to drill into a problem
- Start with the red or amber signal: blocked, overdue, unassigned, falling completion, or weak sales trend.
- Select the metric or related unit/project/goal link.
- Open the unit, project, or goal detail page to see the contributing work.
- Use the people, tasks, history, or sales sections to determine whether the issue is load, ownership, sequencing, or pipeline quality.
- If the issue is systemic, open Constraints and run the analysis.
Operating cadence
- Daily: check blocked work, unassigned tasks, and Today focus.
- Weekly: review goal progress, project flow, and sales conversion.
- Monthly: compare unit history and workload to find repeat patterns. Task counts alone do not measure an individual's effectiveness.
- Any time flow slows: run the constraint analysis and create actions.