 Commandix
Commandix guide
Flow Analytics
Flow Analytics explains how work moves through the system. It is the measurement layer behind bottleneck conversations, delivery forecasting, and workload decisions.
Last reviewed September 19, 2026
View this screen in Commandix
 Enlarge
How to use date ranges
- Open Flow Analytics from the sidebar.
- Set start and end dates or use quick ranges: 7 days, 30 days, or 90 days.
- Review each chart after the data reloads.
- Use shorter windows for active operational problems and longer windows for pattern analysis.
The selected date range applies to historical flow metrics, cumulative flow, throughput, and tasks created for the work-type distribution. Workload, aging WIP, and current constraint evidence show the current operating state, so they do not become historical snapshots when you change the dates.
Metric reference
| Metric | Meaning | How to use it |
|---|---|---|
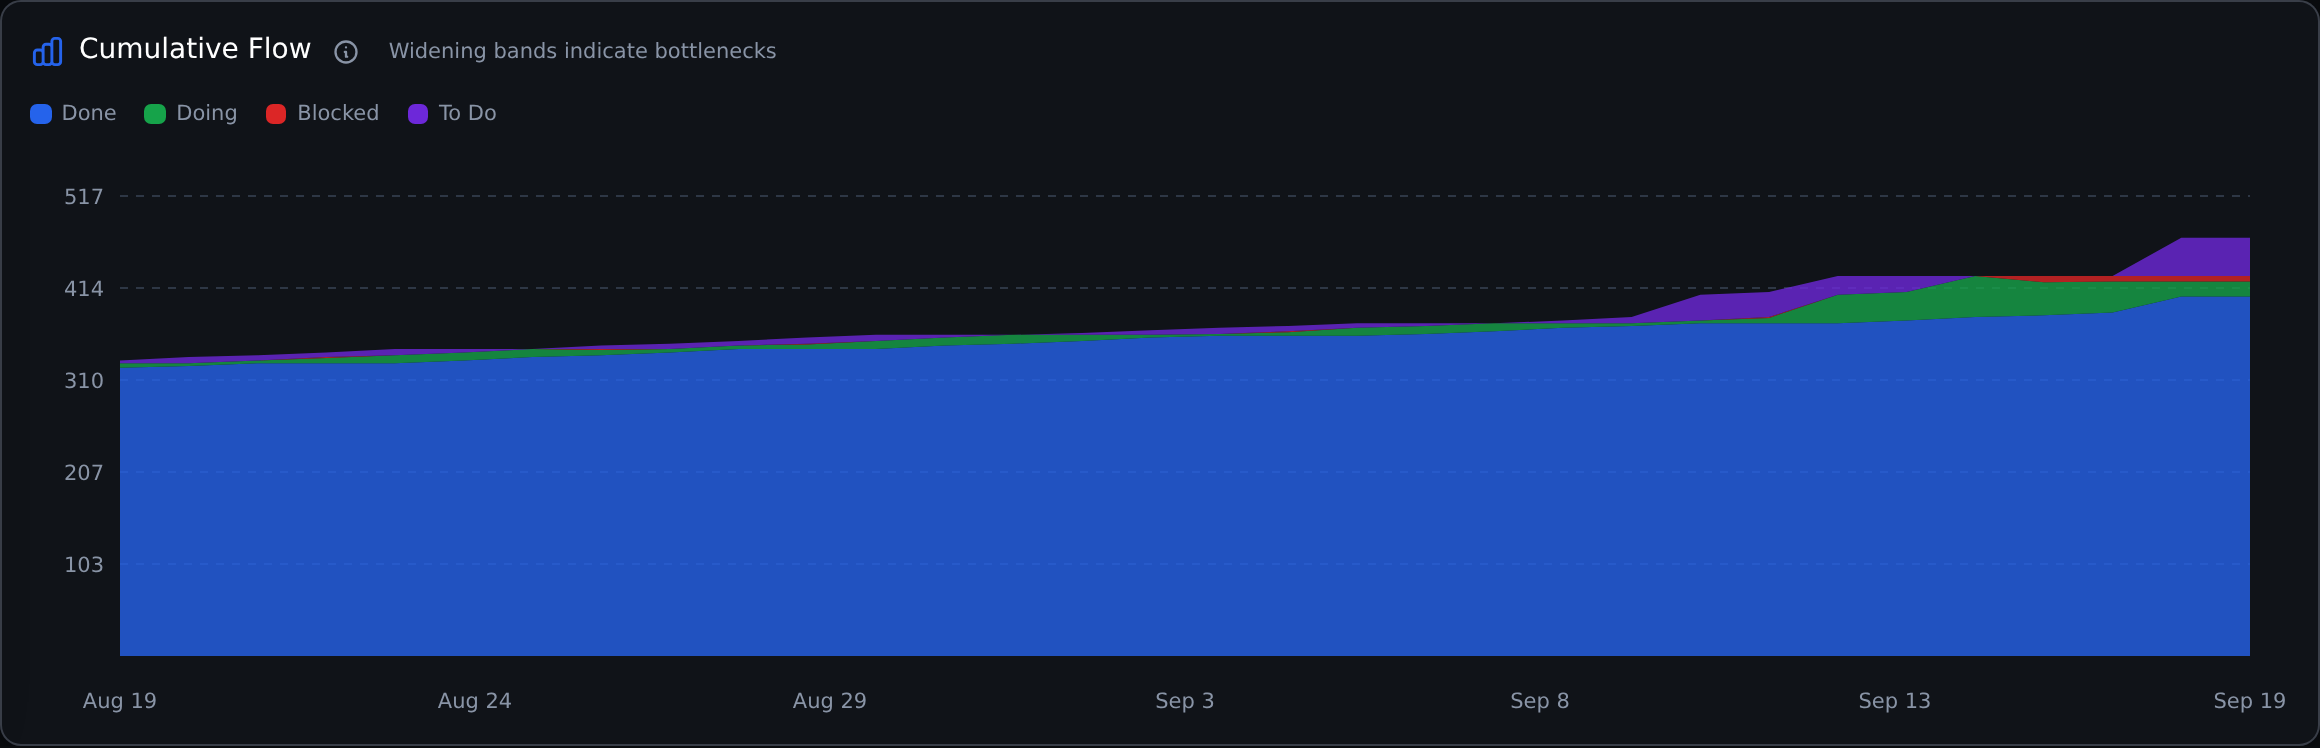
| Cumulative flow diagram | Shows task counts by status over time. | Look for widening bands. A growing active or blocked band means WIP is accumulating faster than work is finishing. |
| Cycle time | Elapsed time from starting work to completion, where recorded. | Use it to compare delivery flow, including waiting after work has started. |
| Lead time | Elapsed time from task creation to completion. | Use it to measure recorded stakeholder waiting time. |
| Flow efficiency | Time recorded in Active divided by total lead time. | This is based on task status history, not measured hours of human effort. Accurate status updates matter. |
| Completed tasks | Throughput for the selected range. | Use it to see whether system output is improving. |
| Work type distribution | Tasks created in the selected period, grouped into business project, internal project, operational change, and unplanned work. | Compare incoming demand, not just completed work. Rework can overlap any category. |
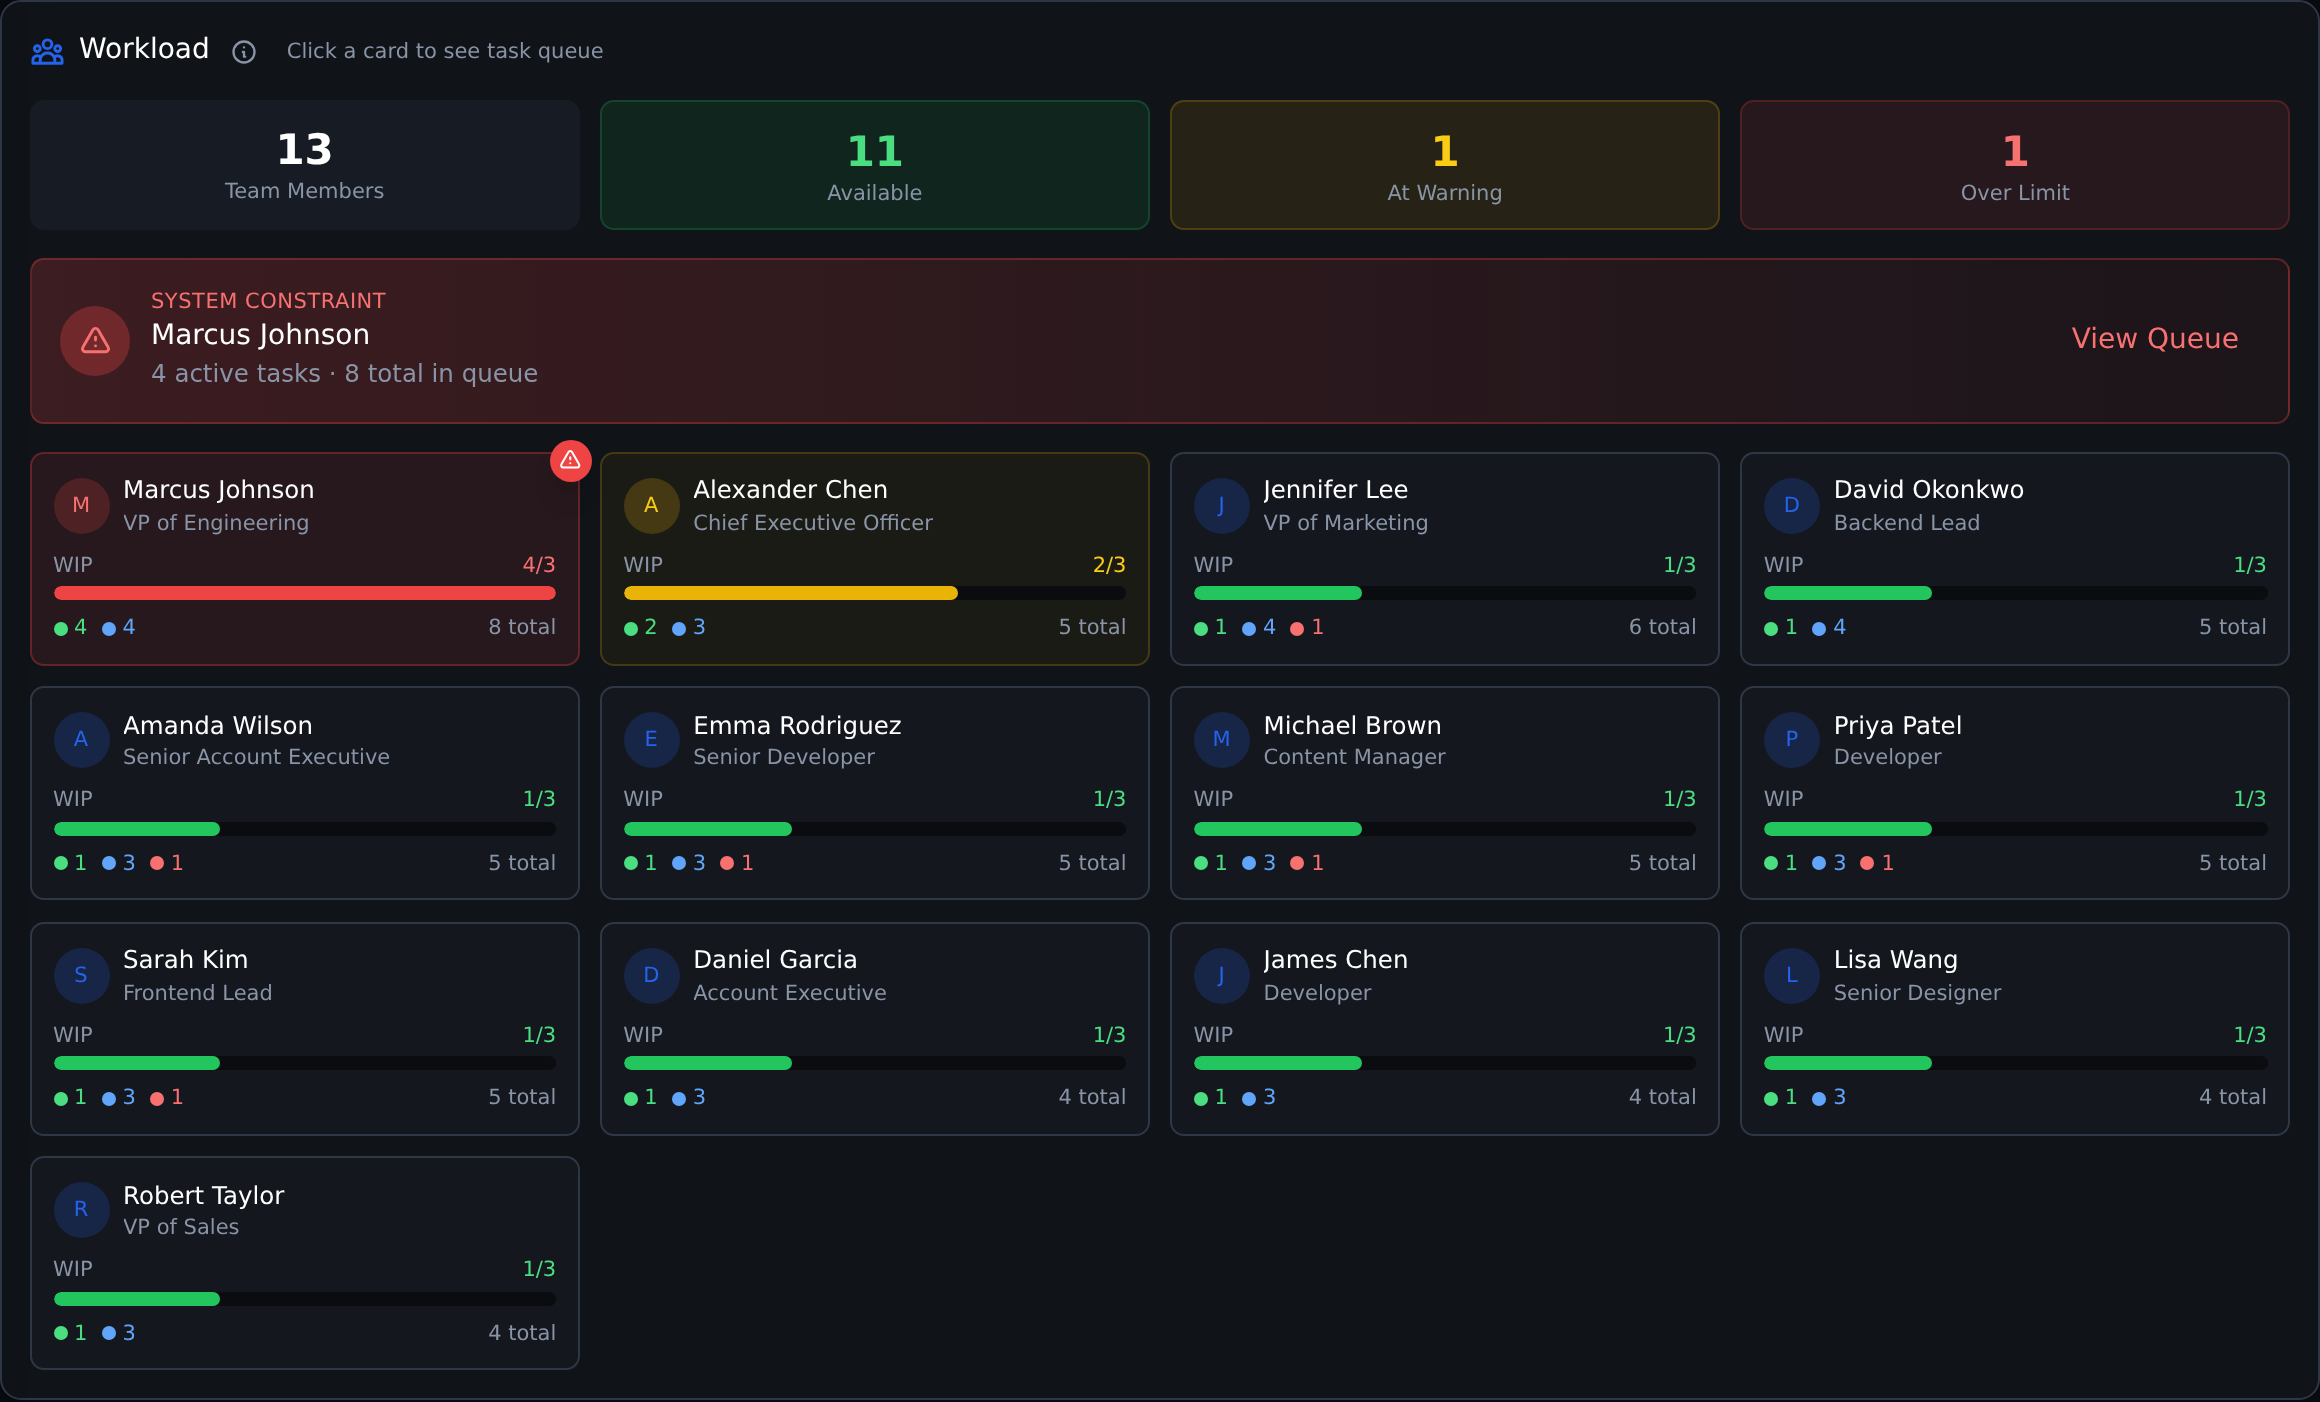
| Workload heatmap | Open work by person and status. | Use it to spot overload, blocked people, and uneven load. |
| Aging WIP | Active or blocked tasks aging beyond normal expectations. | Use it to find work that needs intervention before it becomes a delivery problem. |
Why the cumulative flow chart can be empty
The cumulative flow diagram builds its daily bands from recorded task status history. Without history it can fall back to one current snapshot; that is not enough to show a trend. Widen the date range and verify the recorded transitions before interpreting an empty or single-point chart. Completing a task is not a requirement for an active-work band to appear.
Completion-based charts use currently Done tasks and their last-updated date; editing a completed task can change its reporting bucket. Flow metric summaries additionally require recorded flow measurements, so their completed count can differ from an all-task count or another completion chart.
Workload dashboard vs identified constraint
The workload dashboard answers "who has the most visible work right now?" The identified constraint answers "what limits system throughput the most?" Those can be different. A person with many open tasks may not be blocking the highest-value projects or deals. A person with fewer tasks may be the constraint if their queue blocks downstream work, goals, or revenue.
 Enlarge